You can export your report and save it on your computer by clicking the save button. Most reports are downloaded as an Excel spreadsheet file type, though some reports are downloaded as a CSV file (Comma Separated Values) which is also viewable through your default spreadsheet application as per normal.
Steps
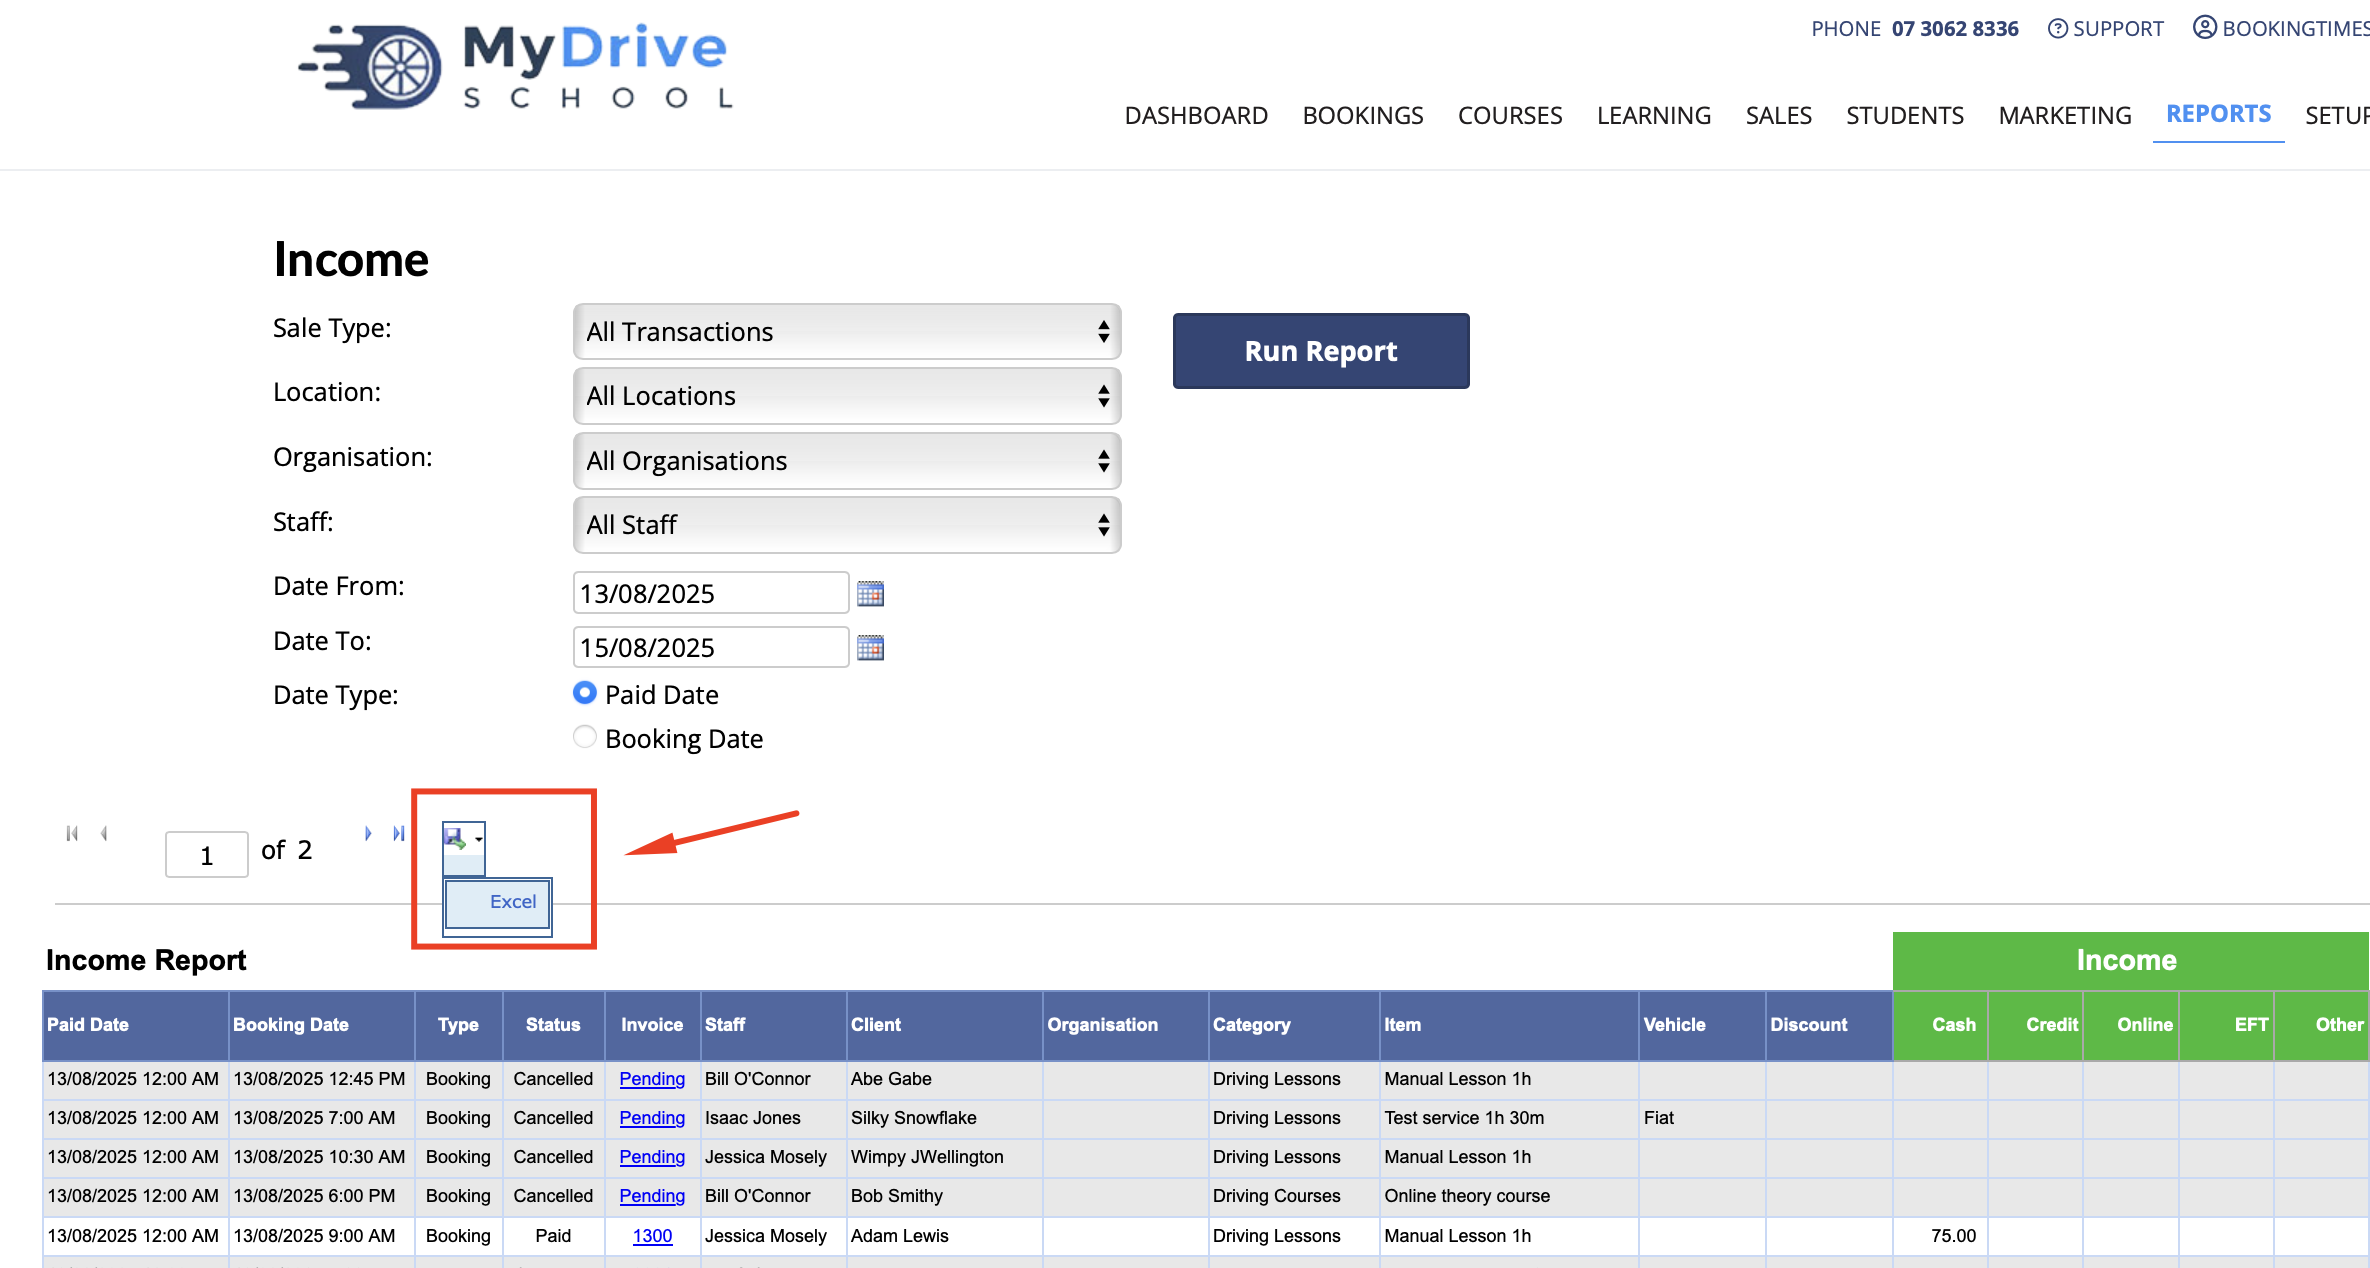
Run your desired report (see Running a report article)
Click the Save Icon above the report and select Excel (or CSV). The report should now be available in your Downloads bar or folder.
CSV files
A CSV (Comma-Separated Values) file is just plain text with data separated by commas (or sometimes semicolons). Excel recognizes this format and lays the data out into rows and columns.
There are two main ways to do it:
Double-click the file
If Excel is your default program for .csv files, just double-click the file and it will open directly in Excel.
Open from Excel
Open Excel → go to File > Open → browse to your .csv file → select it.
Excel will automatically parse the commas into separate columns.
It’s possible that Excel uses your regional settings for decimal/thousand separators) instead of treating a comma as the delimiter so some columns may be merged. So you don’t have to follow step 2 above each time, you can update these settings as follows:
Windows
Go to Control Panel → Region → Additional settings…
Find List separator and set it to , (comma)
Click Apply and restart Excel
Mac
Go to Apple Menu → System Settings → General → Language & Region
Scroll down and click Advanced….
Under the Numbers tab, look for Grouping and Decimal separators
Change the Decimal separator to . (dot)
Change the Grouping separator to , (comma)
Click OK and restart Excel
Advanced filtering in Microsoft Excel
You may wish to filter your report based on more conditions than shown on the online report. You can easily do this by exporting to a spreadsheet application such as Microsoft Excel.
Steps
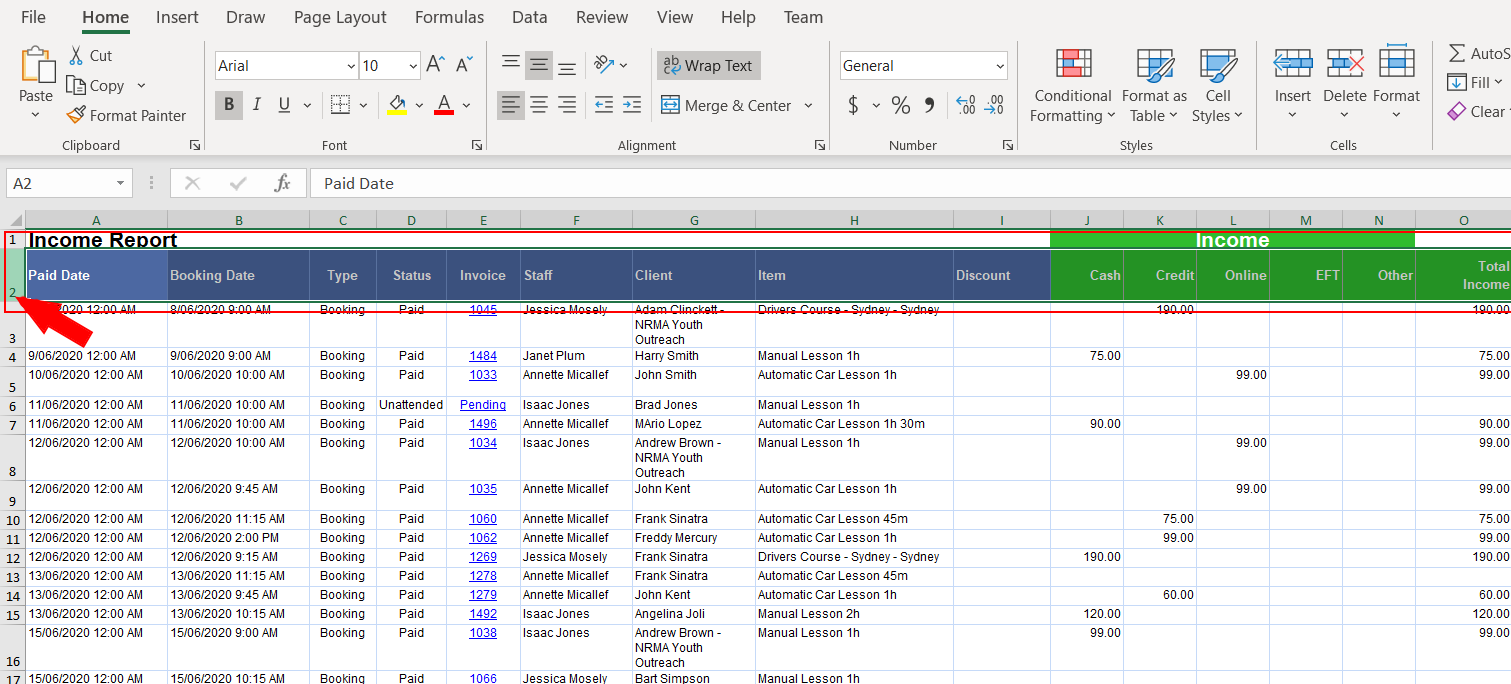
Open your report in Microsoft Excel (ensure it has been exported in the Excel or CSV format)
Select the entire top row of the report by clicking on the left edge of the row
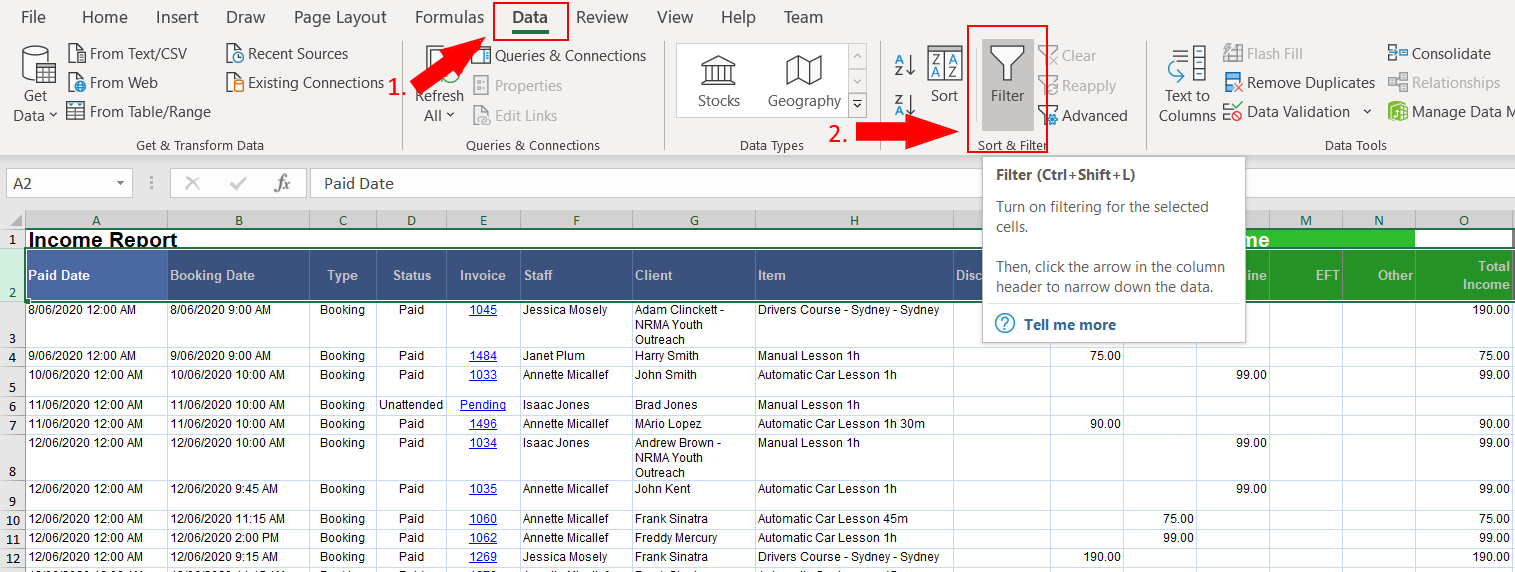
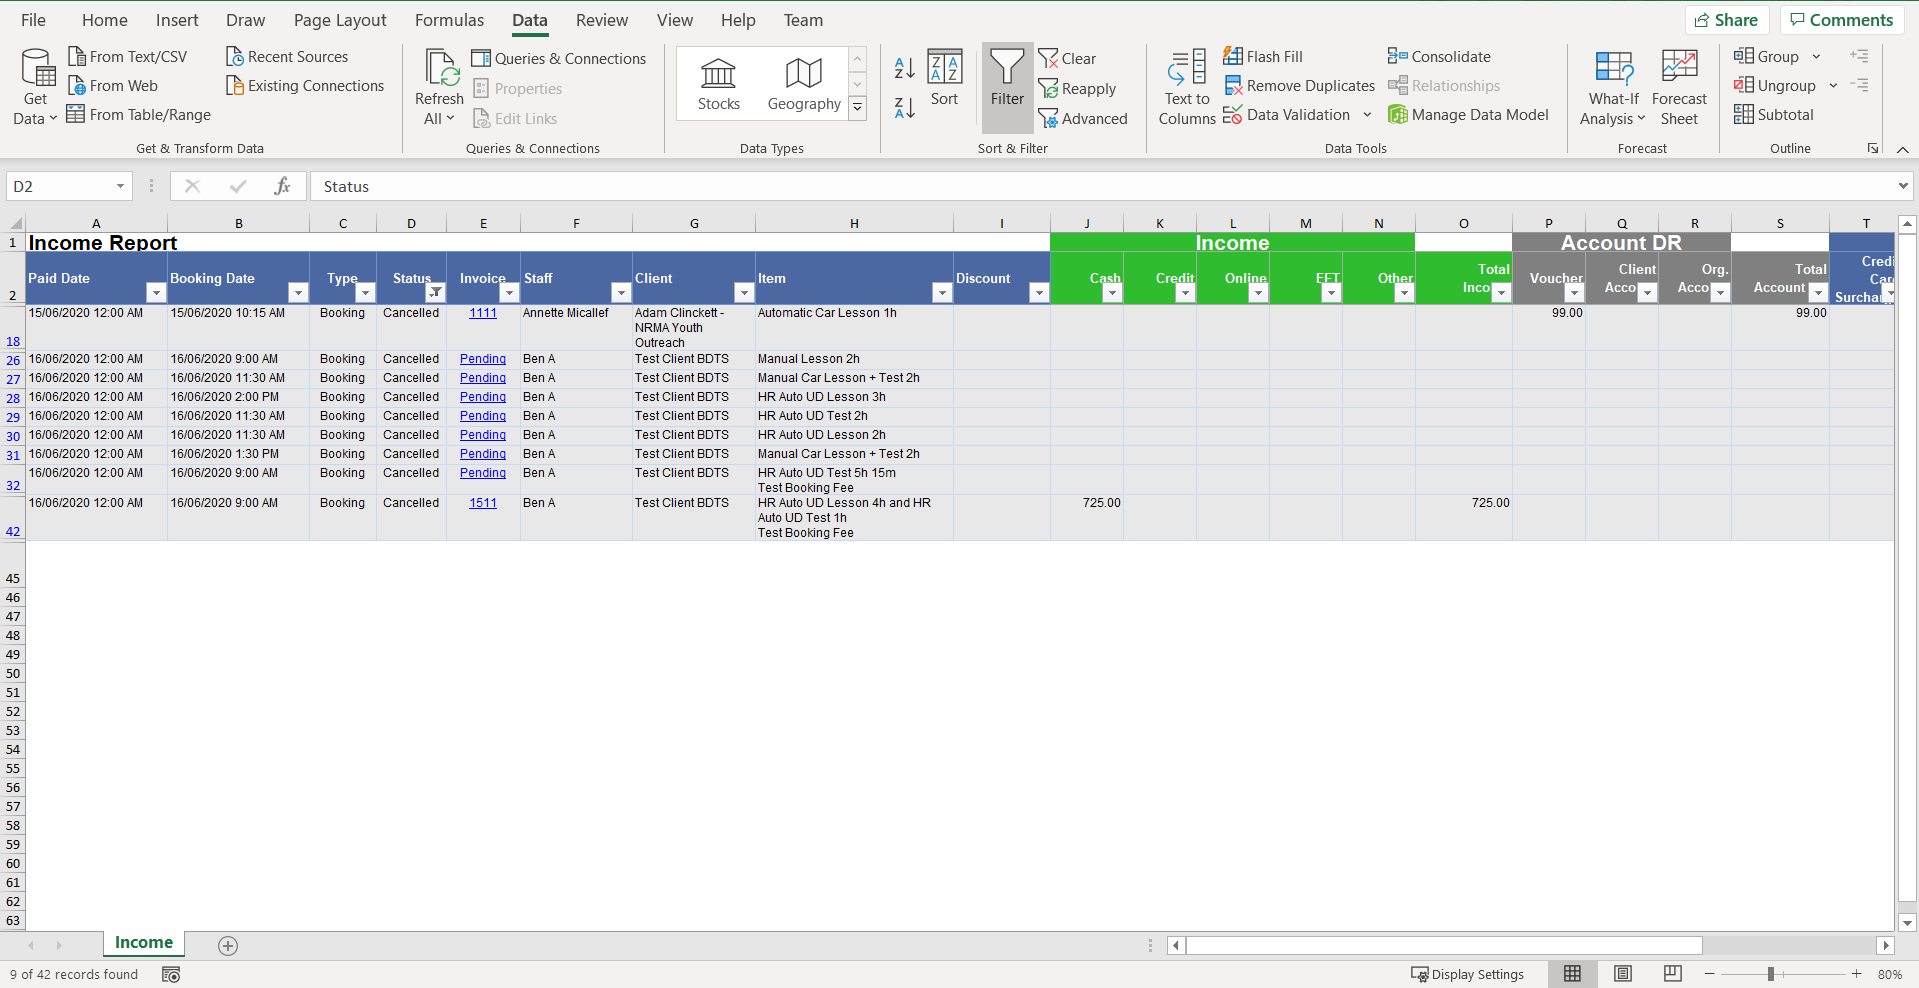
Navigate to the Data tab and select the Filter option
Dropdown arrows will now appear above all your columns which will let you filter by any value stored. For example, we could filter by Paid, Cancelled or Unattended in the Status column.
Click the arrow above your column of choice and tick the filter values. In this case, we will just tick "Cancelled" to show only the Cancelled Bookings.
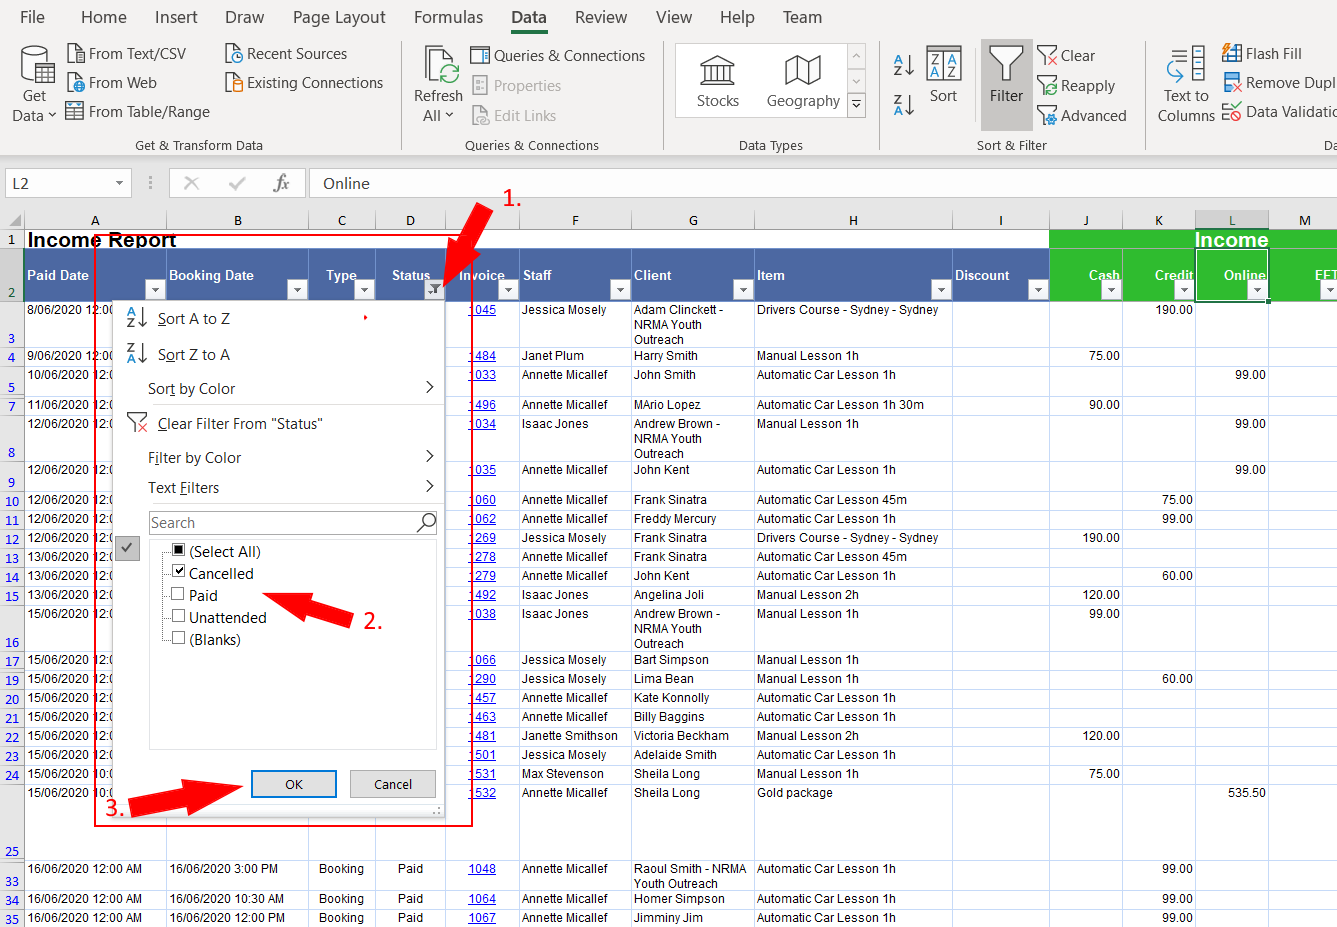
Now the Report has been filtered to only show Cancelled Bookings
Tip
You can add filters to a number of different columns at once. For example, you check "Cancelled" under the "Status" column and a specific name under the "Client" column to see cancelled bookings for only that client in Excel.